Data Analyst Project - Sales Report
Sales report example
This data analyst project is an executive sales report for sales managers.
Data Cleansing and Transformation (SQL)
SQL was used to create the necessary data model for doing analysis
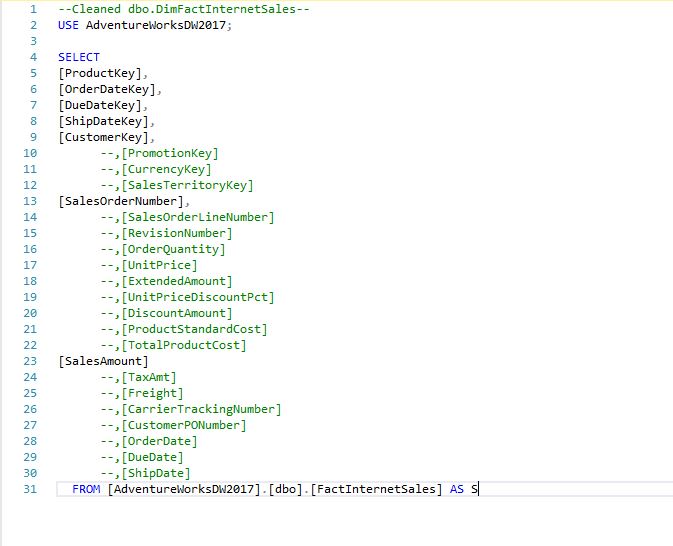
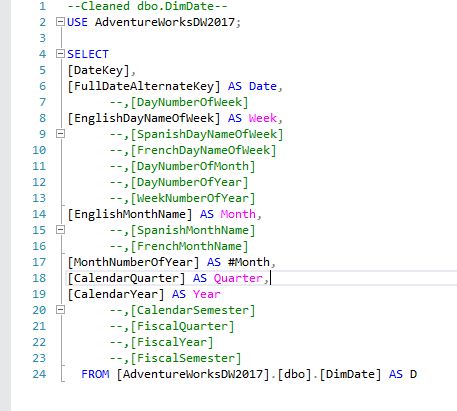
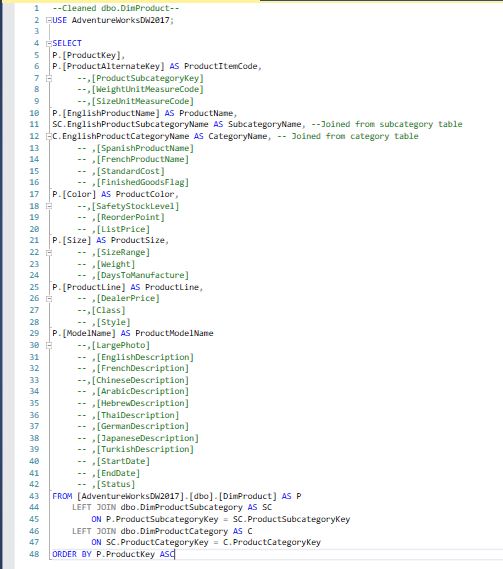
Bellow are the SQL statements for cleansing and transforming necessary data
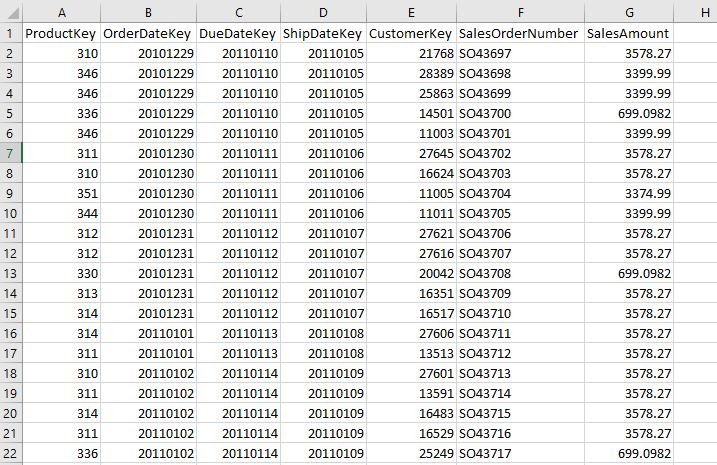
DimFactInternetSales table
DimCalendar table
DimProduct table
DimCustomer table

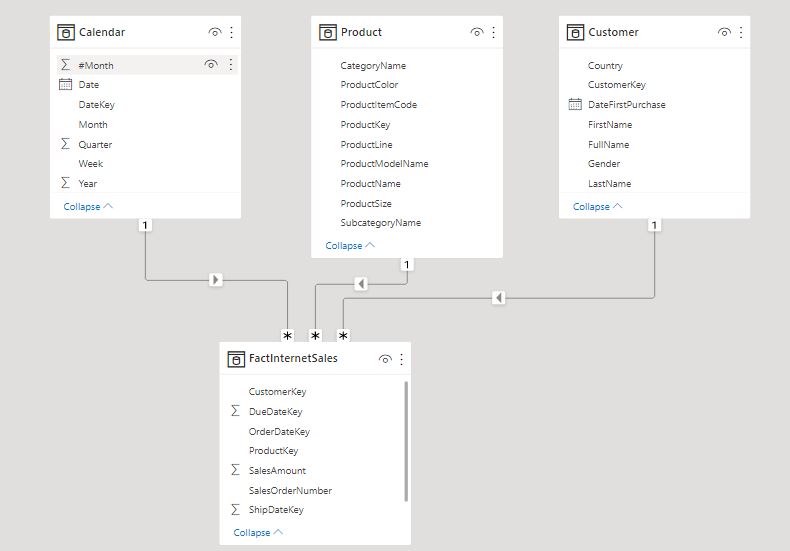
Data Model
Below is a screenshot of the data model after cleansed and prepared tables were read into POWER BI
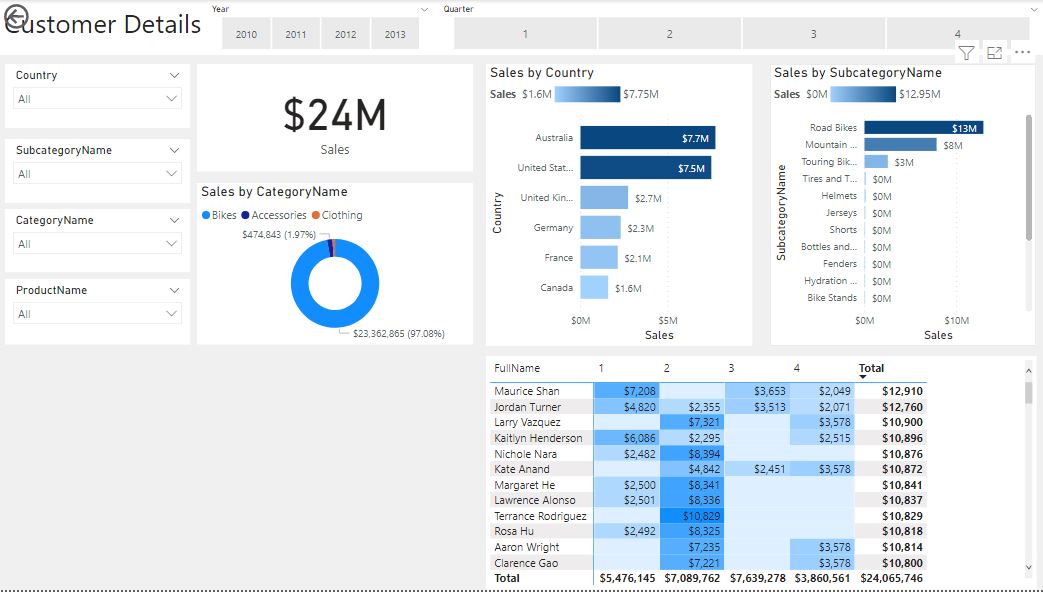
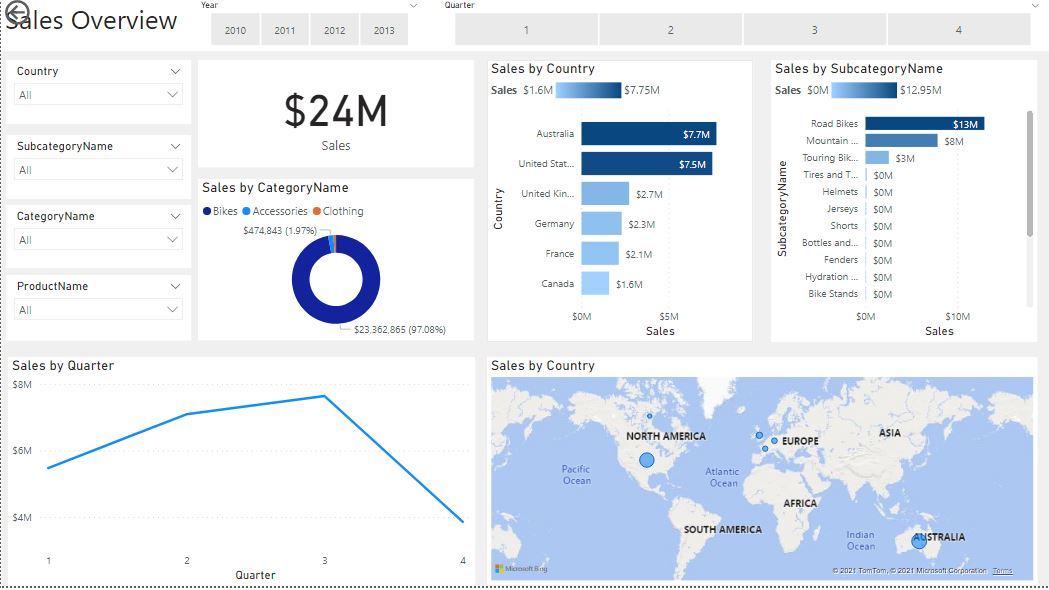
Sales Report Dashboard - POWER BI
The finished Sales Report Dashboard containd two pages. The first one works as an overview and the second page focused on customer details. Both show the necessary details and visualizations of sales overtime per quarter, category and products.